![Japan Auto Industry Data](https://www.jama.org/wp-content/uploads/2013/11/banner5-japan-data.jpg)
Japanese Brand Automobile and Motorcycle Trends in Japan & the U.S.
Annual Trends from JAMA
Japanese-Branded Motor Vehicle Trends in Japan: 1989-2018
![](https://www.jama.org/wp-content/uploads/2019/05/annual_trend_89-18.png)
![](https://www.jama.org/wp-content/uploads/2019/05/motorcycle_annual_trend_89-18.png)
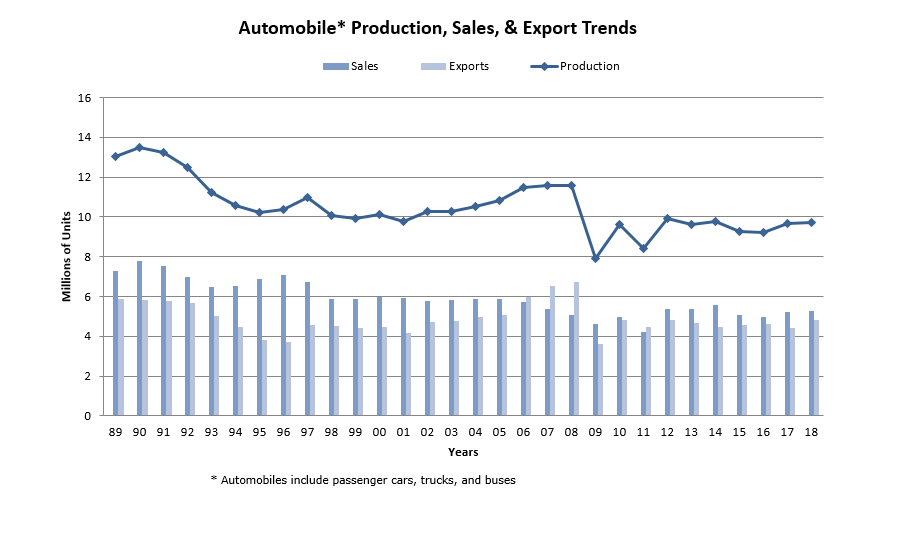
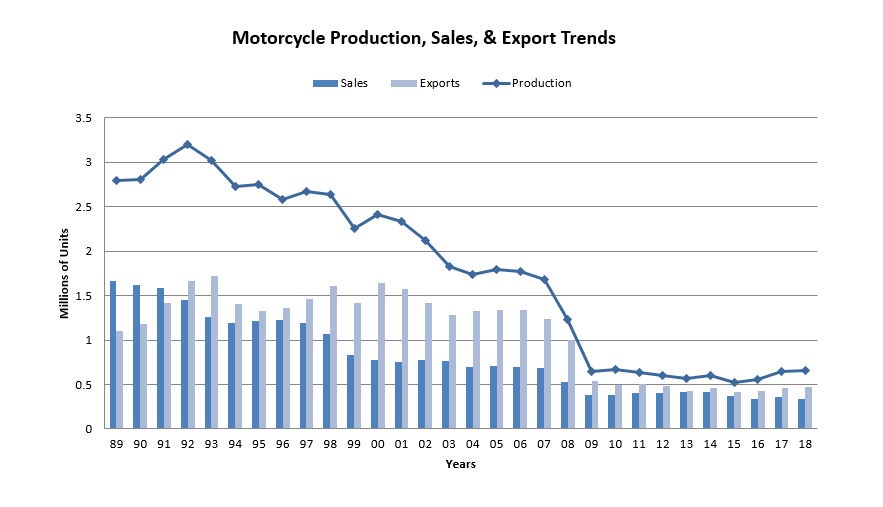
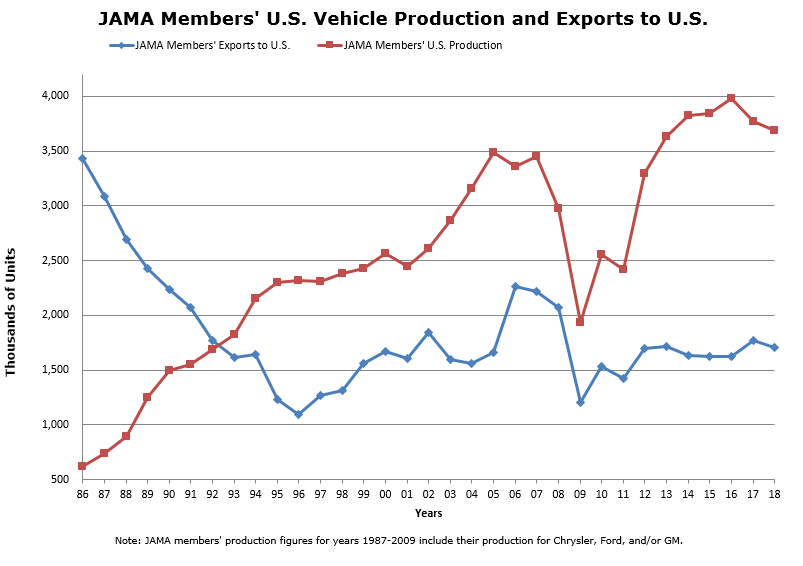
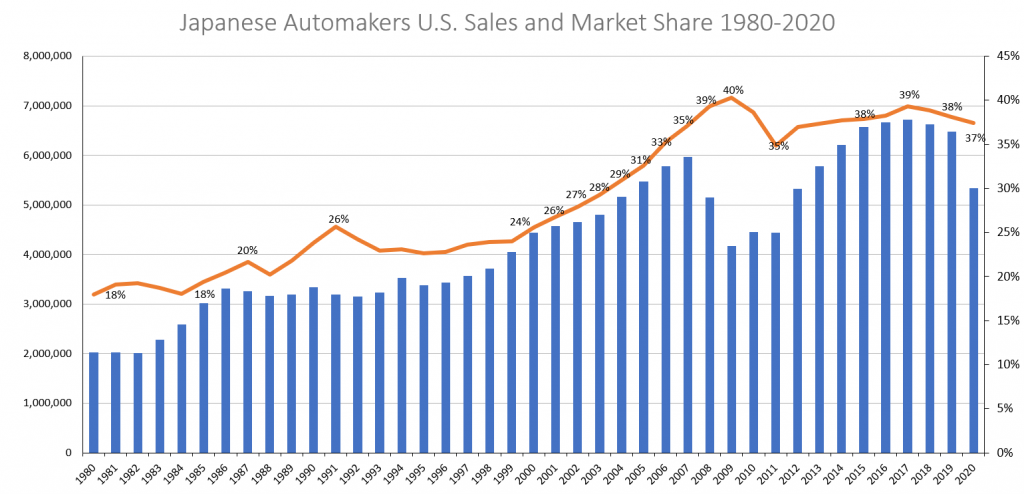
NOTE: Sales, Exports, and Production figures for Japan only.
JAMA Members' Sales of imported Vehicles vs. Sales of Vehicles Built in North America
- In 2018, 70% of Japanese-Brand Vehicles Sold in the U.S. Were Built in North America, with the vast majority being built in the U.S.
- In 1986, only 12% of Japanese-Brand Vehicles Sold in the U.S. Were Built in North America
![](https://www.jama.org/wp-content/uploads/2013/11/Percent_MFG_in_US_1986.png)
![](https://www.jama.org/wp-content/uploads/2019/05/percent_mfg_in_us_86-18.png)
JAMA Members' U.S. Vehicle Production and Exports from Japan: 1986-2018
![](https://www.jama.org/wp-content/uploads/2019/05/us_production_and_japan_exports_86-18.png)
JAMA Members' U.S. Sales and Market Share: 1980-2020
![](https://www.jama.org/wp-content/uploads/2021/11/website-sales-and-market-data-80-20-1024x494.png)